> ## Documentation Index
> Fetch the complete documentation index at: https://docs.cloudcapital.co/llms.txt
> Use this file to discover all available pages before exploring further.
# Cloud Resource Mapping
> Map your cloud accounts and services to Cost Layers so Cloud Capital can accurately forecast and optimise your spend.
Cost Allocation is where you connect your cloud infrastructure to your business structure. Every dollar of AWS spend gets assigned to a **[Cost Layer](/forecasting/cost-layers)** — a named category that reflects how your organisation thinks about its costs. Once mapped, your forecast, savings analysis, and commitment proposals all work from that structure rather than raw AWS account data.
Cost Allocation requires at least one active AWS integration with cost data available. If you've just connected your integration, allow up to 24 hours for data to appear before mapping.
***
## Why Cost Layers matter
Cloud Capital starts every organisation with two top-level cost layers:
* **Production (COGS)** — infrastructure that directly supports your live product or service. From a finance perspective, this is Cost of Goods Sold: the cloud spend that scales with your revenue and belongs on your P\&L as a direct cost of delivering your service.
* **Non-Production (OpEx)** — infrastructure used for development, staging, testing, and internal tooling. This is Operating Expenditure: necessary business cost, but not directly tied to serving customers.
This distinction matters to your finance team. COGS and OpEx are treated differently in financial reporting, margin analysis, and budgeting conversations. Mapping your cloud spend to these two categories from the start means Cloud Capital's forecasts and savings proposals are grounded in the same financial structure your CFO and board use — not just a flat view of your AWS bill.
**Going deeper with sub-layers**
Two top-level layers are the minimum. Most organisations benefit from further structure beneath them, which you can add at any time. Common approaches include:
* **By AWS service** — Compute, Database & Storage, Networking, AI & Analytics. Useful for understanding which service families are driving cost growth, and for engineering teams who want to see their spend split by infrastructure type.
* **By region** — US East, EU West, APAC. Useful for organisations with regulatory, latency, or cost-allocation reasons to track spend by geography.
* **By team or product using AWS tags** — if your engineering teams tag their resources, you can create cost layers that reflect those tags, giving you per-team or per-product spend visibility directly in your forecast.
* **By business line** — Core Product, Data Pipeline, Internal Tools. Useful for companies with multiple products or revenue streams that want to understand cloud cost per product line.
You don't need to set up all of this on day one. Start with Production / Non-Production, get your forecast running, and add granularity as your needs become clearer. See [Cost Layers](/forecasting/cost-layers) for full details on managing and refining your structure over time.
***
## Getting there
Navigate to **Cost Allocation** using the left sidebar, or click **Cost Allocation** at the top of the **Cloud Provider Integrations** page.
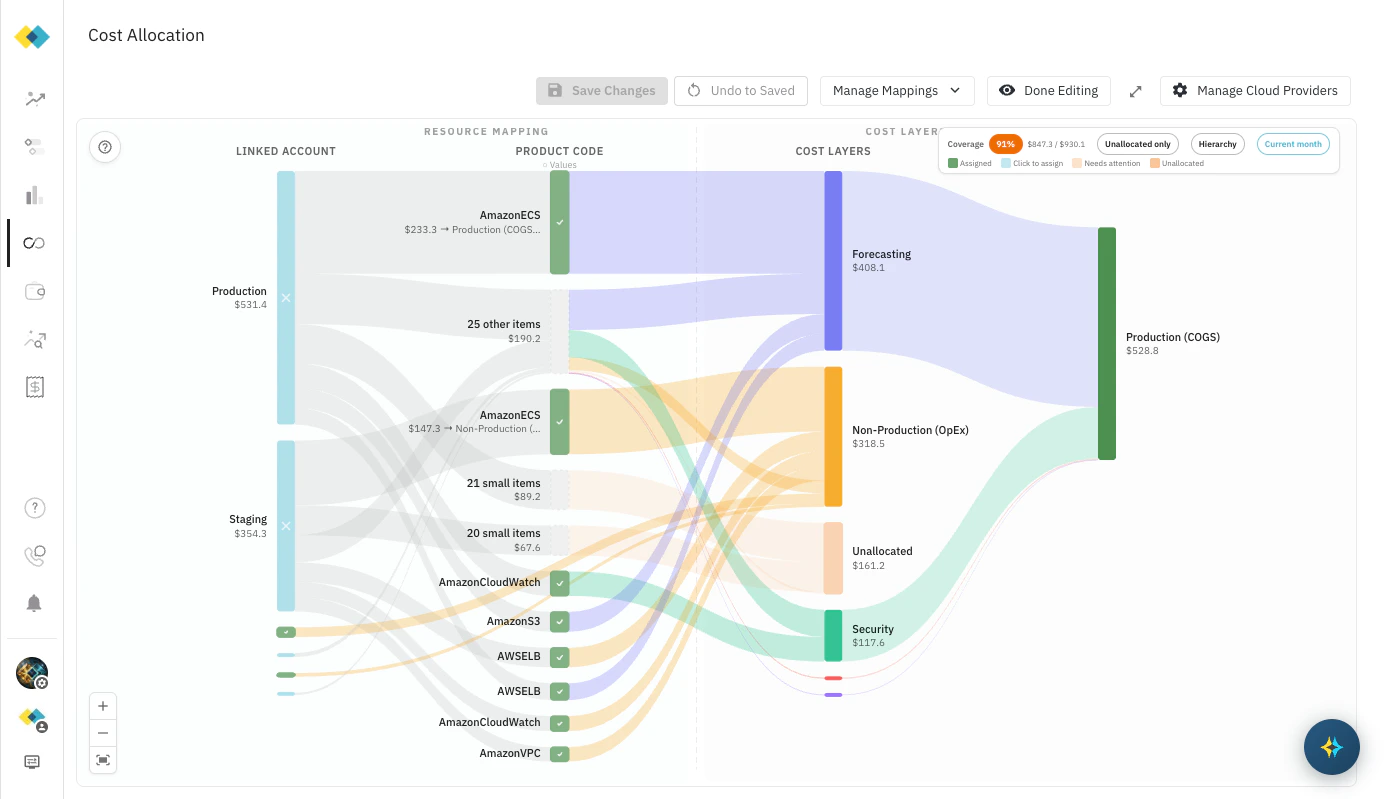
The canvas shows a Sankey diagram flowing left to right. **Linked Accounts** sit on the left — your AWS accounts are always the starting point. In the middle, breakdown dimensions are flexible: by default this is **Product Code** (AWS services within each account), but the columns between accounts and cost layers can vary. **Cost Layers** — your business categories — appear on the right.
Flow width represents spend volume. Colour indicates assignment status: green (assigned), amber (needs attention), peach (unallocated).
 ***
## Mapping your resources
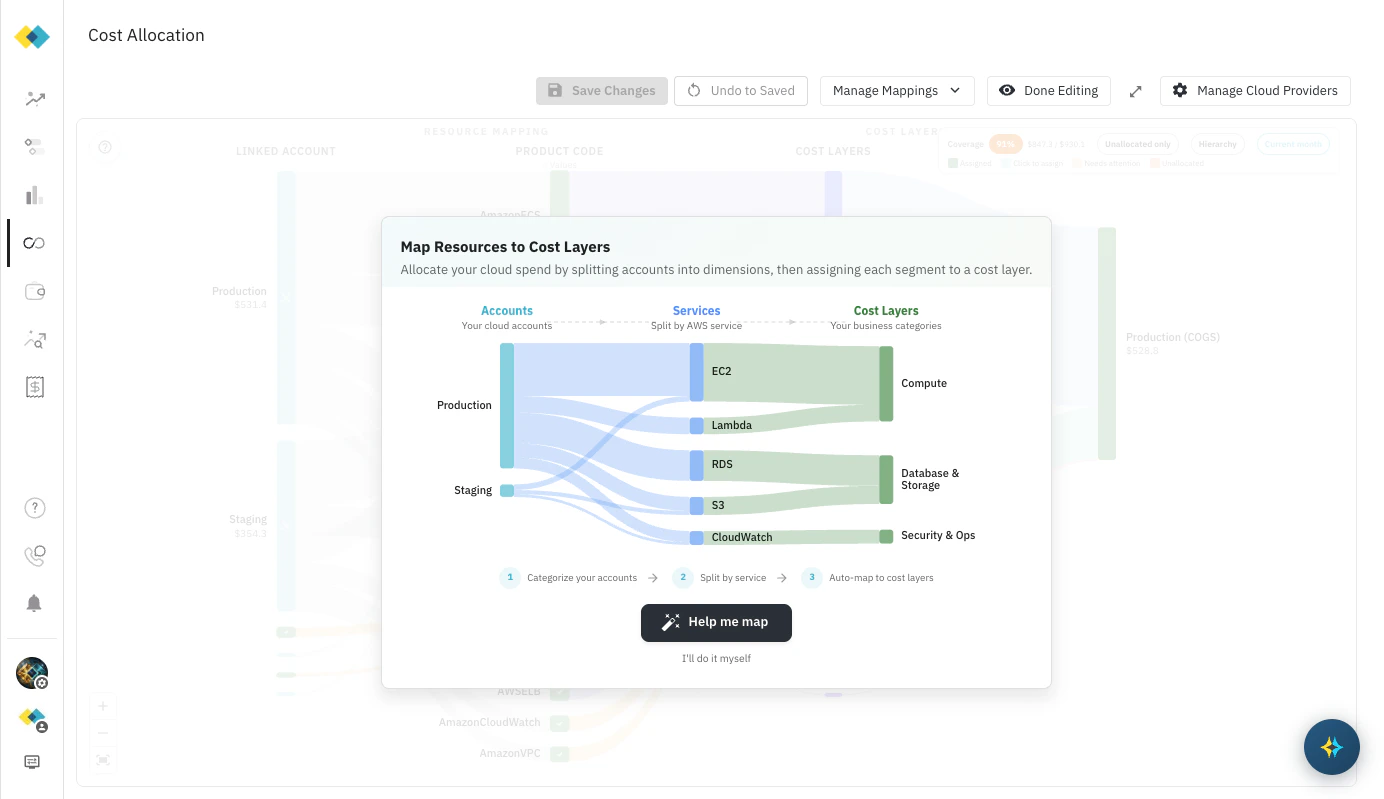
When you open Cost Allocation, click the **?** icon in the top-left of the canvas to open the mapping guide. You can take either path:
***
## Mapping your resources
When you open Cost Allocation, click the **?** icon in the top-left of the canvas to open the mapping guide. You can take either path:
 ***
### Help me map (guided)
The guided flow walks through mapping in four steps. Cloud Capital suggests a cost layer structure based on your accounts and services — you review and adjust before anything is applied.
**Step 1 — Map your accounts**
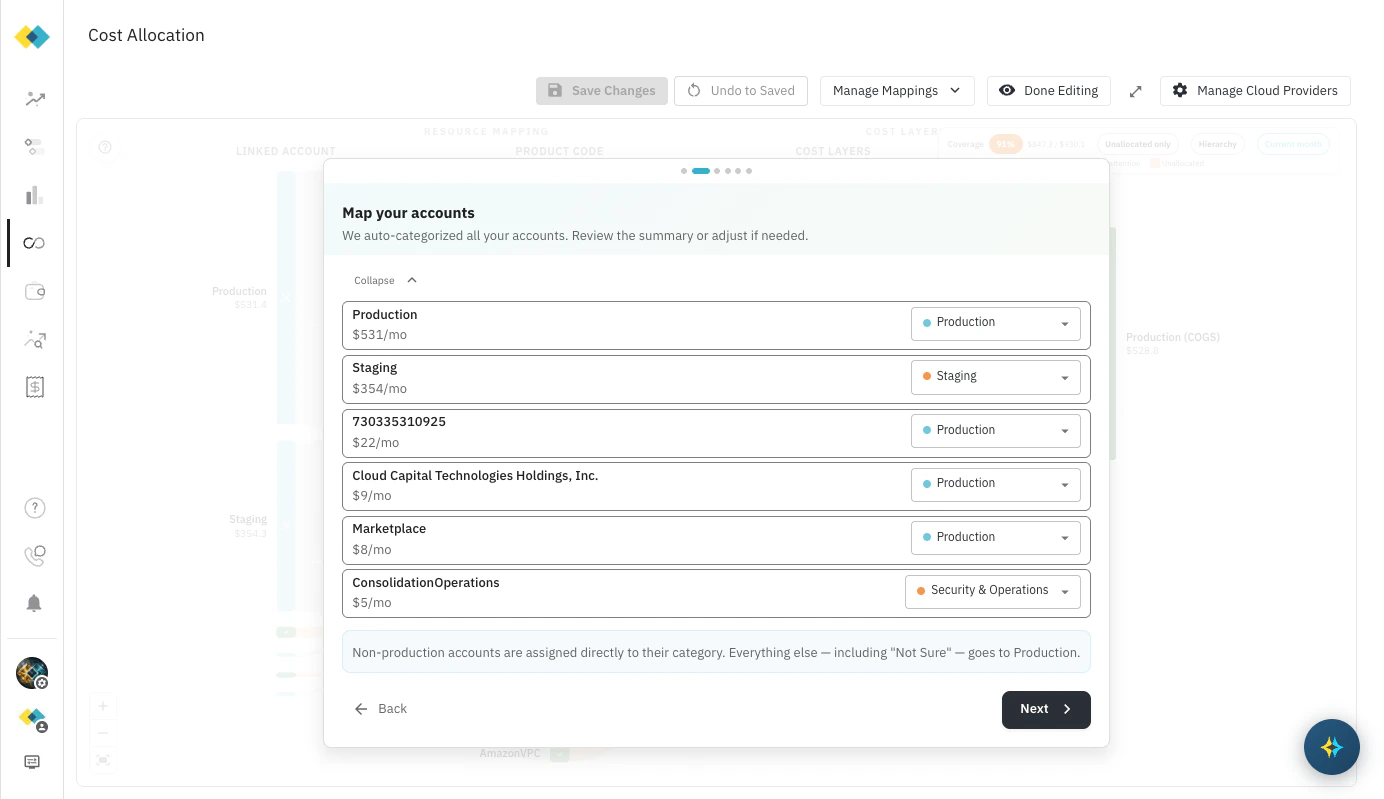
Cloud Capital analyses your account names and suggests a cost layer structure — automatically grouping accounts into Production, Staging, or Security & Operations. If you have your own preferred structure, the suggestions are a starting point: every account can be overridden before anything is applied. The summary shows how many accounts landed in each suggested category.
Expand **Review or change assignments** to see every account with its suggested category and a dropdown to change it.
Non-production accounts (Staging, Dev, Sandbox) are assigned directly to their category. Everything else — including accounts Cloud Capital isn't confident about — defaults to Production. Check any account that doesn't look right before continuing.
***
### Help me map (guided)
The guided flow walks through mapping in four steps. Cloud Capital suggests a cost layer structure based on your accounts and services — you review and adjust before anything is applied.
**Step 1 — Map your accounts**
Cloud Capital analyses your account names and suggests a cost layer structure — automatically grouping accounts into Production, Staging, or Security & Operations. If you have your own preferred structure, the suggestions are a starting point: every account can be overridden before anything is applied. The summary shows how many accounts landed in each suggested category.
Expand **Review or change assignments** to see every account with its suggested category and a dropdown to change it.
Non-production accounts (Staging, Dev, Sandbox) are assigned directly to their category. Everything else — including accounts Cloud Capital isn't confident about — defaults to Production. Check any account that doesn't look right before continuing.
 **Step 2 — Organise production accounts (optional)**
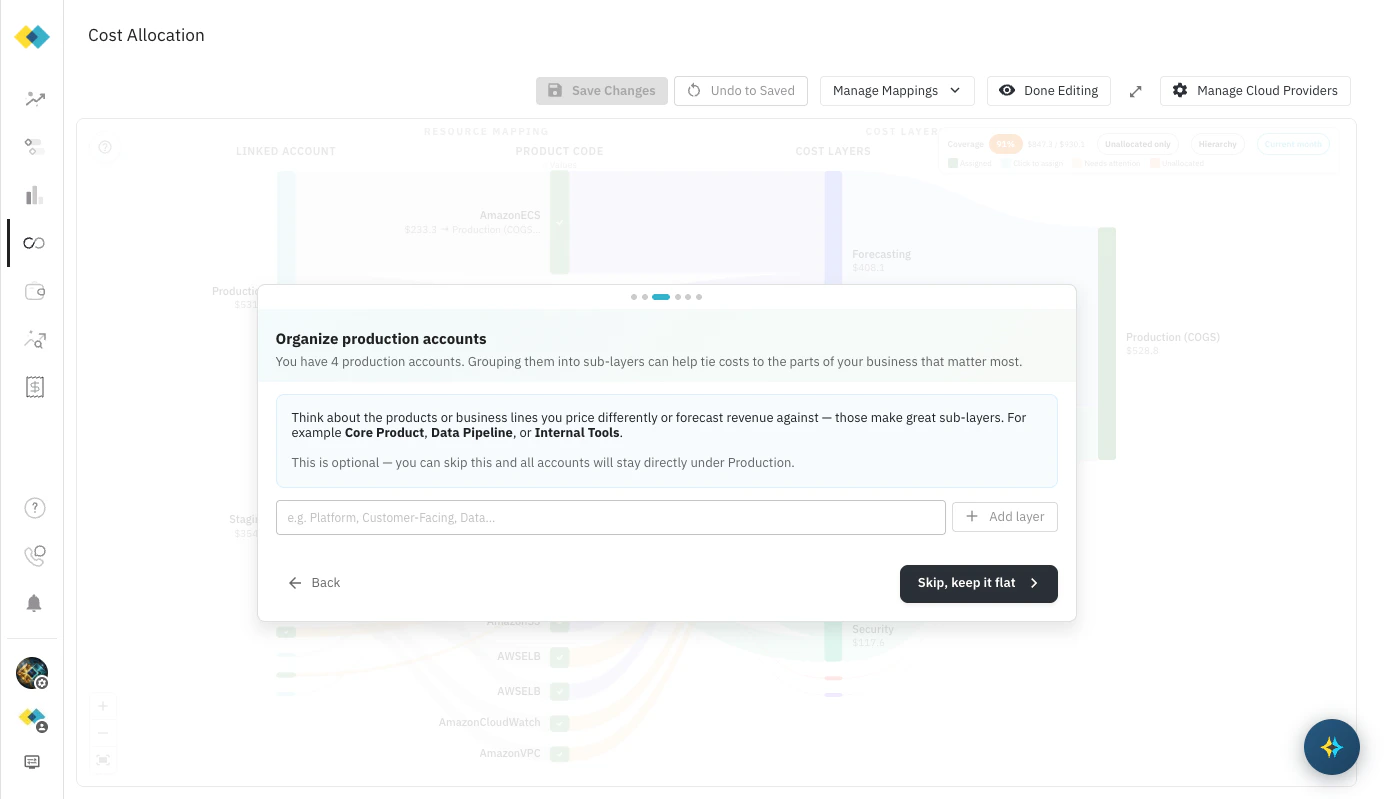
If you have multiple production accounts representing distinct products, teams, or pipelines, you can group them into named [sub-layers](/forecasting/cost-layers) under Production here. Type a name and click **Add layer**.
This step is optional — click **Skip, keep it flat** to leave all production accounts directly under Production and move on.
**Step 2 — Organise production accounts (optional)**
If you have multiple production accounts representing distinct products, teams, or pipelines, you can group them into named [sub-layers](/forecasting/cost-layers) under Production here. Type a name and click **Add layer**.
This step is optional — click **Skip, keep it flat** to leave all production accounts directly under Production and move on.
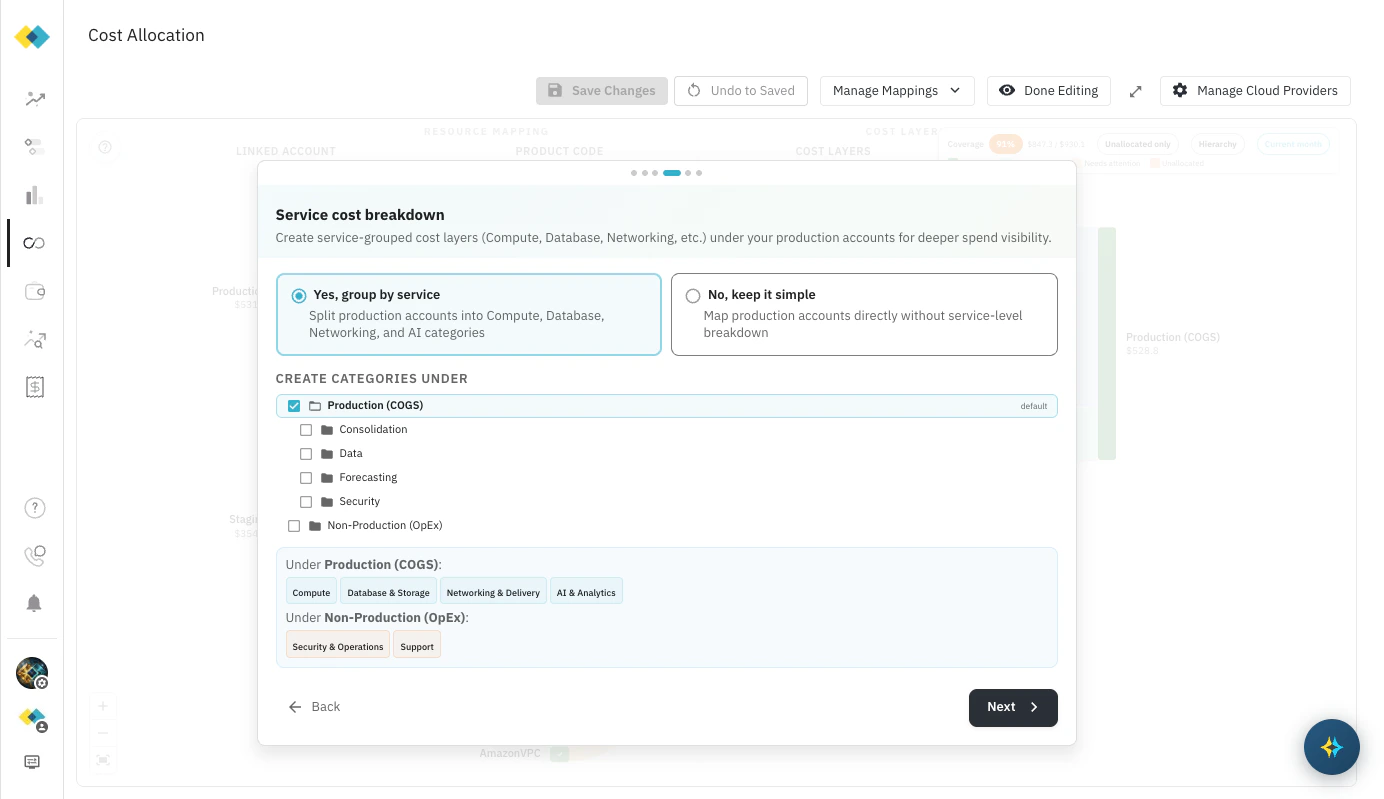
 **Step 3 — Service cost breakdown**
Choose whether to split production spend by AWS service category:
* **Yes, group by service** — Cloud Capital creates sub-layers for Compute, Database & Storage, Networking & Delivery, and AI & Analytics under your selected cost layers. The preview at the bottom shows exactly which categories will be created under Production (COGS) and Non-Production (OpEx).
* **No, keep it simple** — production accounts map directly to their cost layer without service-level breakdown.
Use the checkboxes to select which cost layers get service sub-layers created beneath them.
**Step 3 — Service cost breakdown**
Choose whether to split production spend by AWS service category:
* **Yes, group by service** — Cloud Capital creates sub-layers for Compute, Database & Storage, Networking & Delivery, and AI & Analytics under your selected cost layers. The preview at the bottom shows exactly which categories will be created under Production (COGS) and Non-Production (OpEx).
* **No, keep it simple** — production accounts map directly to their cost layer without service-level breakdown.
Use the checkboxes to select which cost layers get service sub-layers created beneath them.
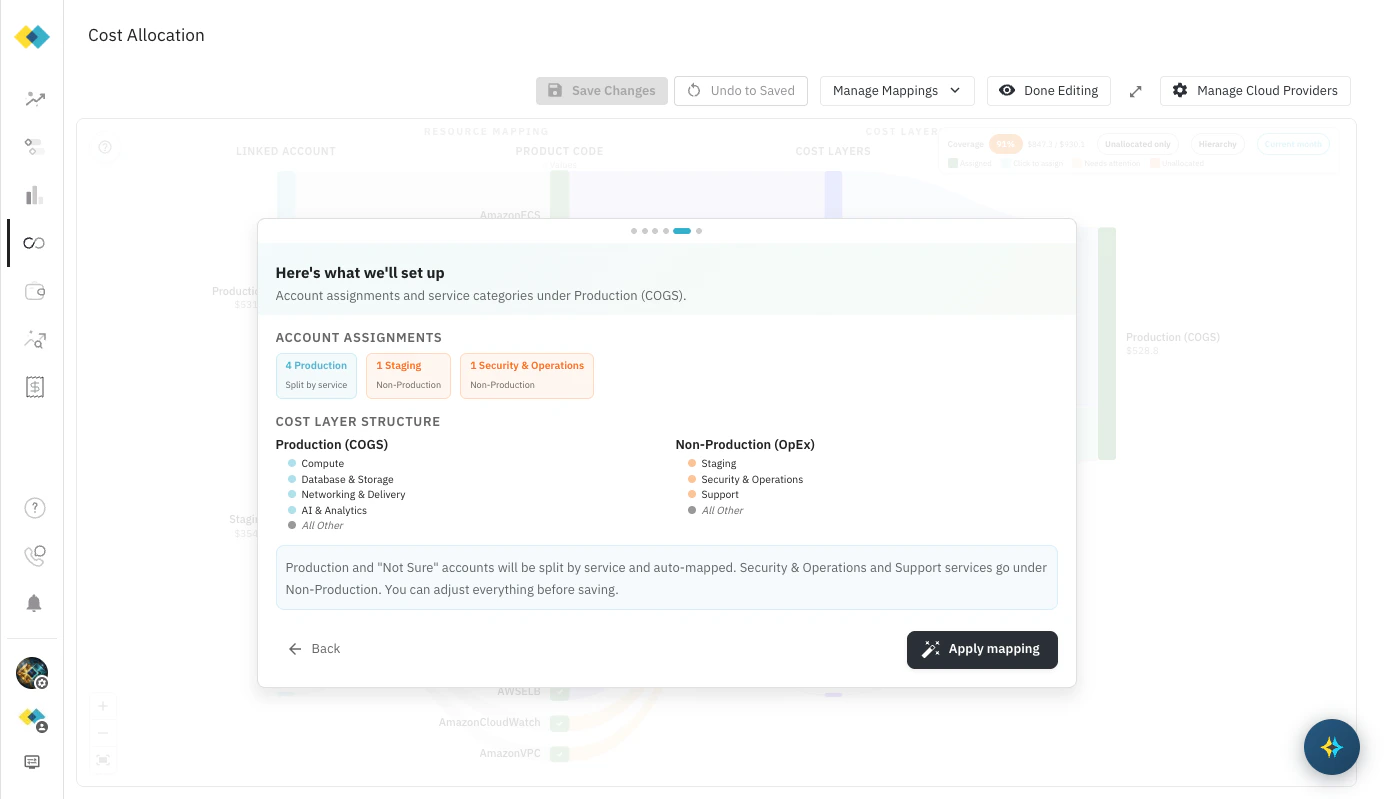
 **Step 4 — Review and apply**
A full summary shows all account assignments and the cost layer structure that will be created. Review it, then click **Apply mapping** to write the changes to the canvas.
Applying the mapping only updates your local canvas view. Nothing is saved to your account until you click **Save Changes** in the toolbar.
**Step 4 — Review and apply**
A full summary shows all account assignments and the cost layer structure that will be created. Review it, then click **Apply mapping** to write the changes to the canvas.
Applying the mapping only updates your local canvas view. Nothing is saved to your account until you click **Save Changes** in the toolbar.
 ***
### I'll do it myself (manual)
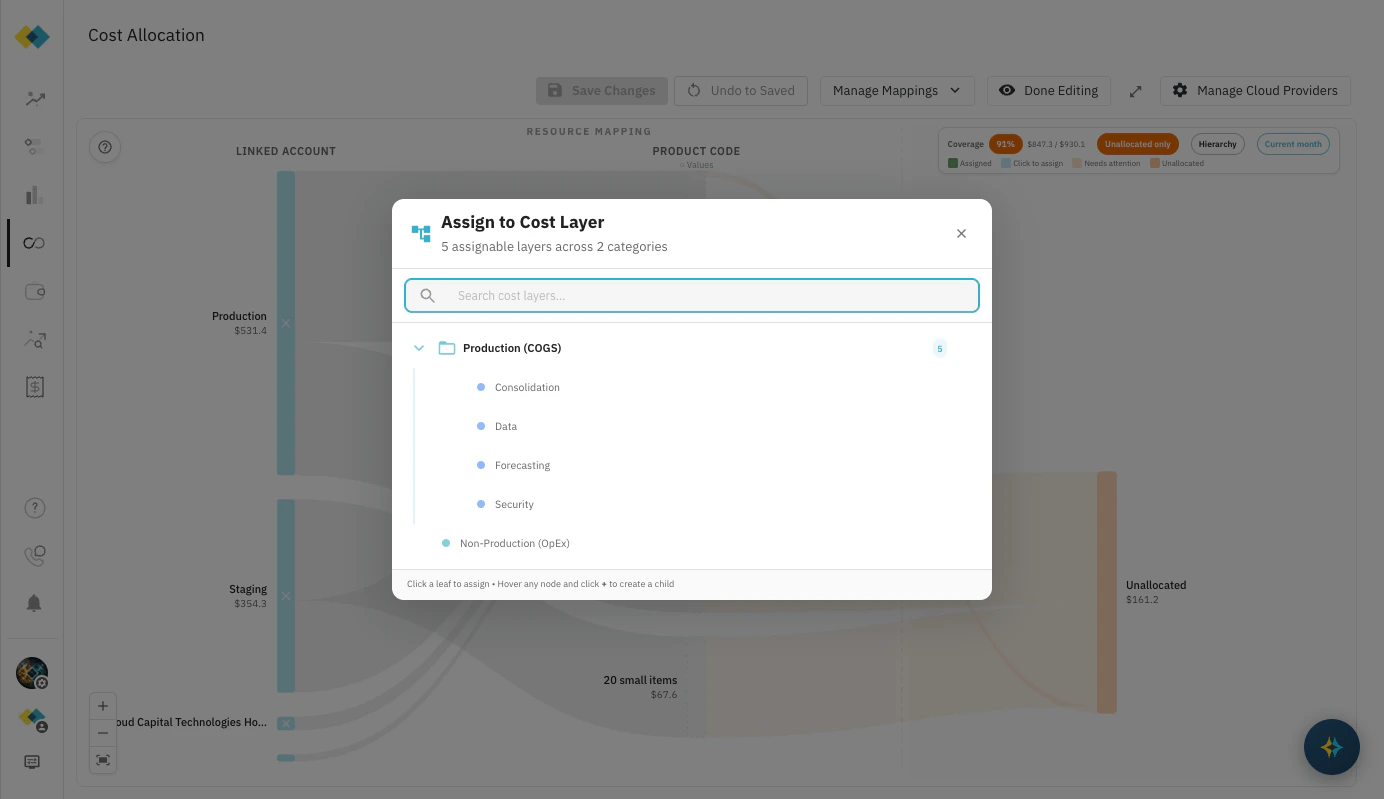
Dismiss the guide and work directly on the canvas. Click any **Product Code** node in the middle column to open the **Assign to Cost Layer** picker.
The picker shows your full [cost layer](/forecasting/cost-layers) tree with a search field. Click any leaf layer to assign that service to it. Hover any layer and click **+** to create a new child layer on the spot — useful if you want to add a sub-layer you didn't set up in the guided flow.
***
### I'll do it myself (manual)
Dismiss the guide and work directly on the canvas. Click any **Product Code** node in the middle column to open the **Assign to Cost Layer** picker.
The picker shows your full [cost layer](/forecasting/cost-layers) tree with a search field. Click any leaf layer to assign that service to it. Hover any layer and click **+** to create a new child layer on the spot — useful if you want to add a sub-layer you didn't set up in the guided flow.
 ***
## Canvas controls
### Toolbar
| Button | What it does |
| -------------------------- | ----------------------------------------------------------------------------------------------------------------------------------------------------------------------------------------------------------------------------------- |
| **Save Changes** | Saves all mapping changes permanently. Only active when unsaved edits exist. |
| **Undo to Saved** | Reverts all unsaved changes to the last saved state. |
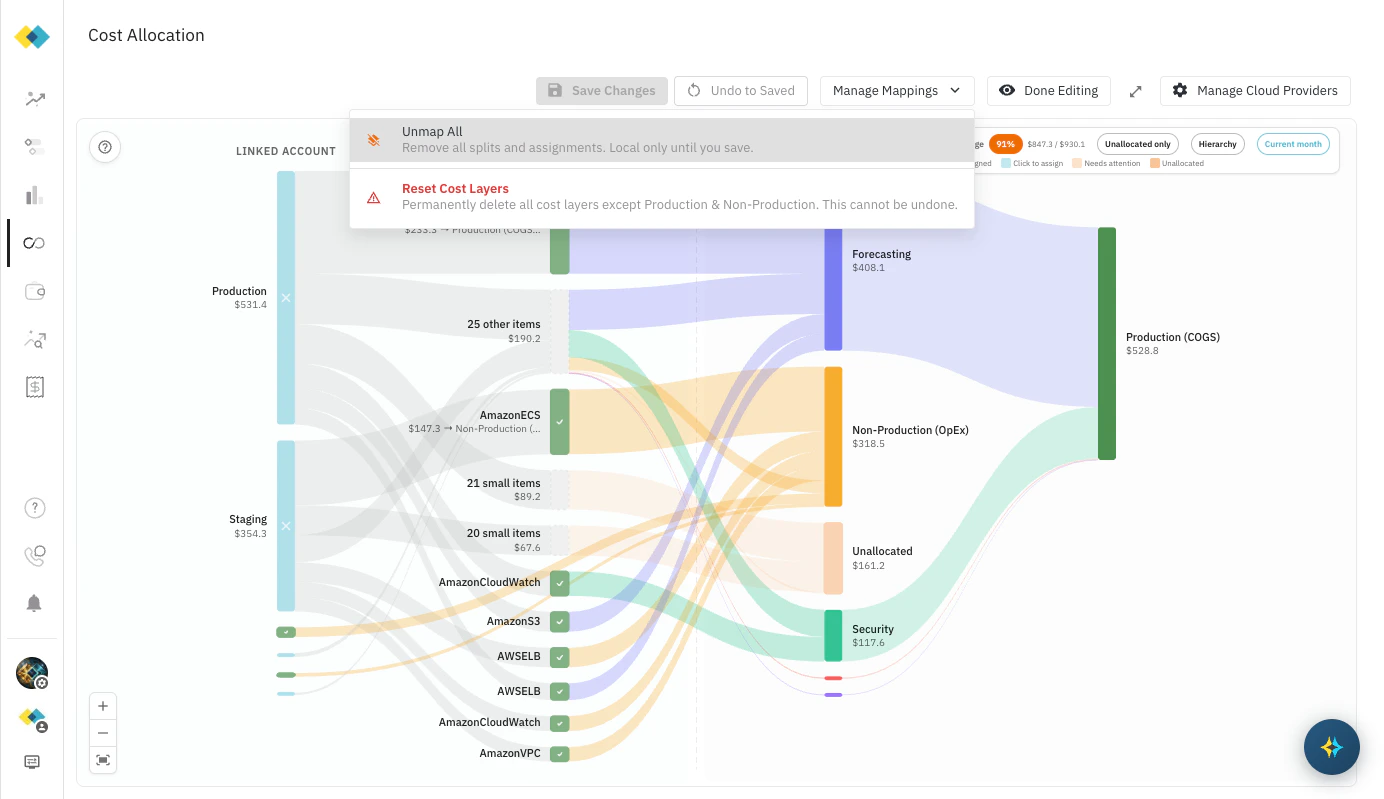
| **Manage Mappings** | Dropdown with two options: **Unmap All** removes all splits and assignments locally (reversible until saved); **Reset Cost Layers** permanently deletes all cost layers except Production & Non-Production — this cannot be undone. |
| **Done Editing** | Returns to read-only view. |
| **Manage Cloud Providers** | Opens the Cloud Provider Integrations page. |
***
## Canvas controls
### Toolbar
| Button | What it does |
| -------------------------- | ----------------------------------------------------------------------------------------------------------------------------------------------------------------------------------------------------------------------------------- |
| **Save Changes** | Saves all mapping changes permanently. Only active when unsaved edits exist. |
| **Undo to Saved** | Reverts all unsaved changes to the last saved state. |
| **Manage Mappings** | Dropdown with two options: **Unmap All** removes all splits and assignments locally (reversible until saved); **Reset Cost Layers** permanently deletes all cost layers except Production & Non-Production — this cannot be undone. |
| **Done Editing** | Returns to read-only view. |
| **Manage Cloud Providers** | Opens the Cloud Provider Integrations page. |
 ### Filters
| Filter | What it does |
| -------------------- | ---------------------------------------------------------------------------------------------------------------- |
| **Coverage %** | Shows the percentage of total spend assigned to a cost layer. Aim for 90%+ before moving to forecasting. |
| **Unallocated only** | Filters the canvas to show only accounts and services not yet assigned — the fastest way to find remaining gaps. |
| **Hierarchy** | Toggles between leaf-level layers only and the full cost layer hierarchy. |
| **Current month** | Switches spend figures between current month and all-time totals. |
### Filters
| Filter | What it does |
| -------------------- | ---------------------------------------------------------------------------------------------------------------- |
| **Coverage %** | Shows the percentage of total spend assigned to a cost layer. Aim for 90%+ before moving to forecasting. |
| **Unallocated only** | Filters the canvas to show only accounts and services not yet assigned — the fastest way to find remaining gaps. |
| **Hierarchy** | Toggles between leaf-level layers only and the full cost layer hierarchy. |
| **Current month** | Switches spend figures between current month and all-time totals. |
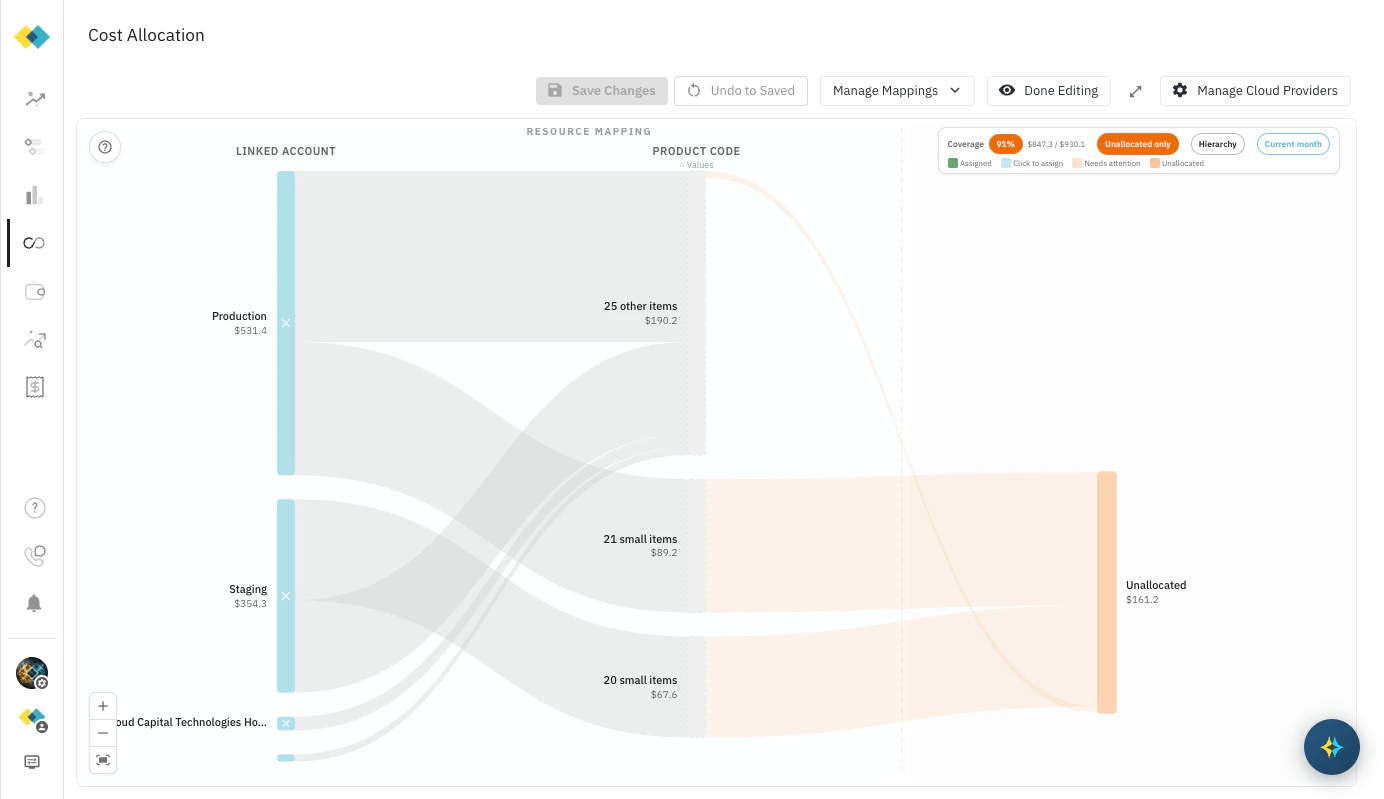 The **+** / **−** buttons in the bottom-left corner zoom the canvas in and out. The icon below them resets to the default zoom.
***
## Saving your work
Changes are local until you click **Save Changes** in the toolbar. Navigate away without saving and your edits will be lost.
Once saved, your [Cost Layer](/forecasting/cost-layers) assignments feed directly into your Cloud Capital forecast. The structure you create here becomes the foundation your forecast, savings analysis, and commitment proposals are all built on.
***
## What's next
How the Help me map wizard categorises accounts and services — and how to get the best results.
Review and refine your cost layer structure, add sub-layers, and adjust assignments over time.
Connect business data to drive more accurate cost projections.
The **+** / **−** buttons in the bottom-left corner zoom the canvas in and out. The icon below them resets to the default zoom.
***
## Saving your work
Changes are local until you click **Save Changes** in the toolbar. Navigate away without saving and your edits will be lost.
Once saved, your [Cost Layer](/forecasting/cost-layers) assignments feed directly into your Cloud Capital forecast. The structure you create here becomes the foundation your forecast, savings analysis, and commitment proposals are all built on.
***
## What's next
How the Help me map wizard categorises accounts and services — and how to get the best results.
Review and refine your cost layer structure, add sub-layers, and adjust assignments over time.
Connect business data to drive more accurate cost projections.