Your business metrics
The Business Metrics page shows all metrics you have defined, with a row for each one.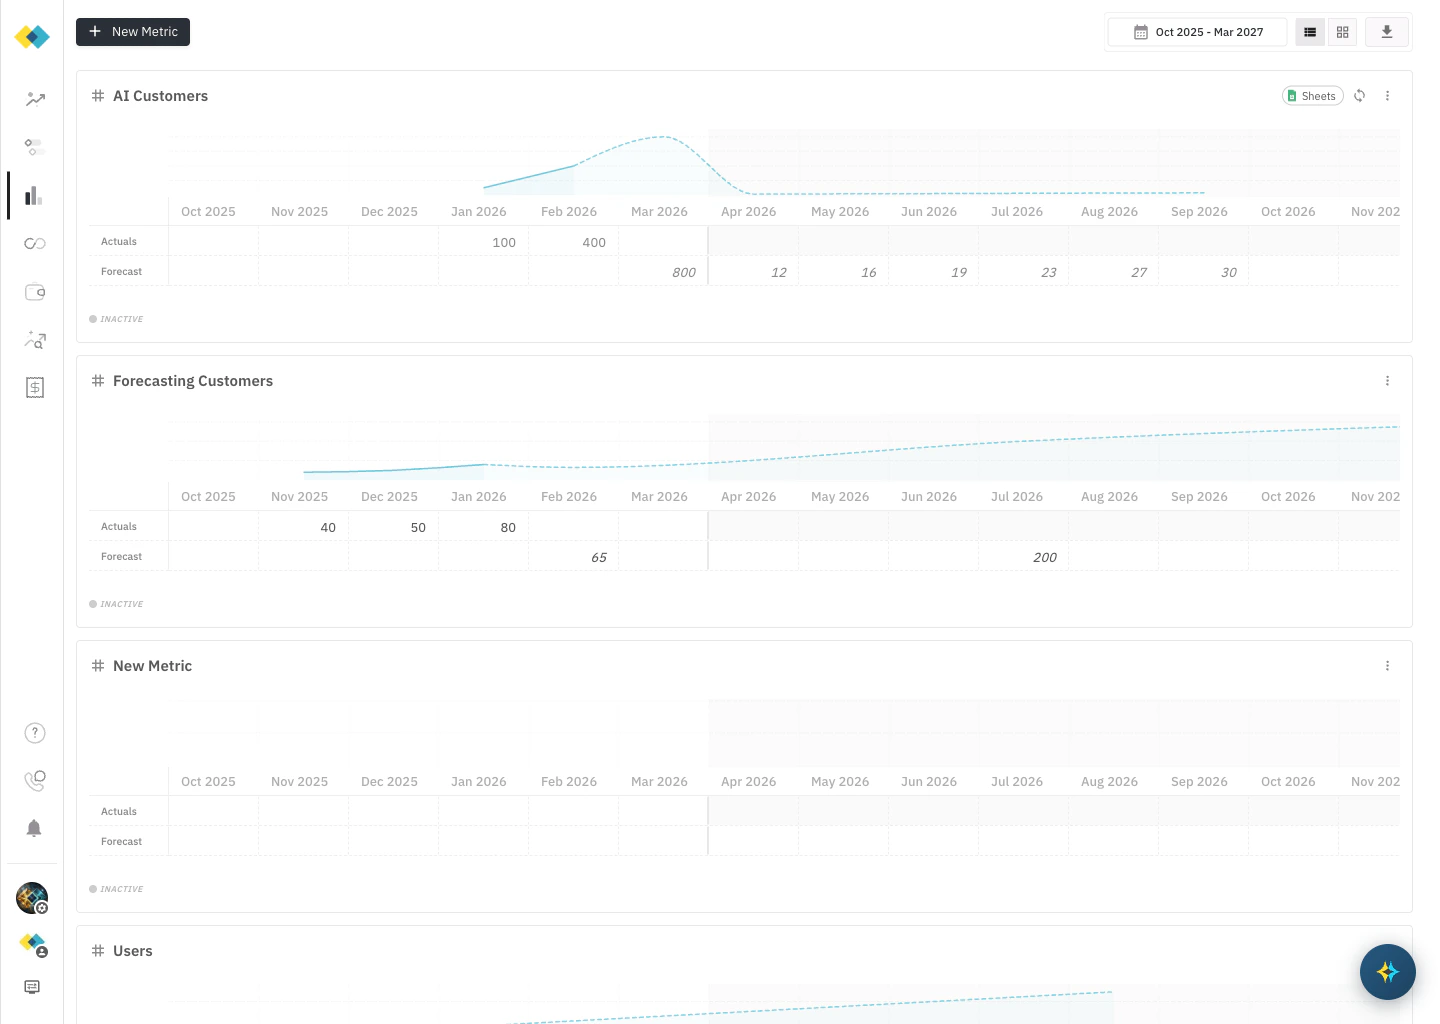
- Actuals — historical values you have already observed
- Forecast — projected values going forward, aligned with your business plan
Adding a business metric
Click + New Business Metric, enter a name for the metric, and press Enter. The new metric appears inline with editable cells.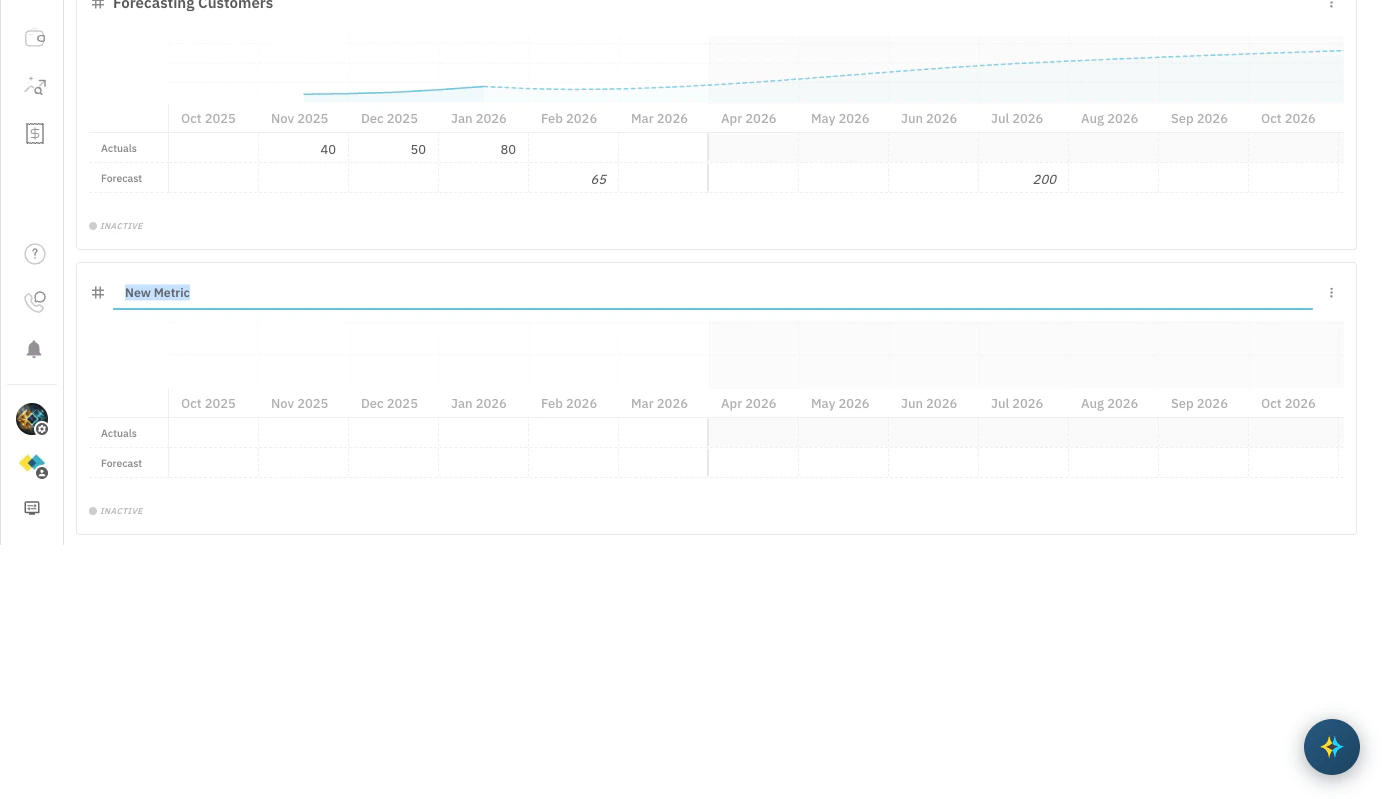
- Name it after what it measures, not what it predicts. “Paying Customers” is better than “Production Cost Driver”.
- Actuals first. The more historical overlap between metric values and actual cost data, the stronger the correlation Cloud Capital can calculate.
- Forecast values come from your business plan. Use the same growth assumptions Finance is already using for budgeting.
What makes a good metric
A good business metric moves in step with the cost it is being connected to. If your production infrastructure cost grows as you add customers, then customer count is a good metric for your production Cost Layer. The stronger and more consistent that historical relationship, the more useful the metric becomes. Good metrics to consider:- Customer count or active users (for production / customer-serving infrastructure)
- Monthly recurring revenue or transactions (for billing or payment processing workloads)
- Internal users or seat count (for internal tooling or collaboration infrastructure)
- Data volume or events processed (for data pipeline or analytics cost layers)
What makes a poor metric
Not every number correlates with every cost. A metric that moves independently of the cost layer it is connected to will not produce a meaningful forecast — it will inject noise rather than signal. Signs a metric may be a poor fit:- The cost layer includes infrastructure that scales with engineering effort, not business volume (consider Engineering Initiatives instead)
- The metric is flat or nearly flat historically while costs vary significantly
- The metric tracks a business outcome that lags the actual cost driver by months
- The app shows Insufficient Data — meaning fewer than 3 months of overlapping metric and cost history exist (see correlation feedback below)
Connecting a metric to a Cost Layer
Business metrics take effect when you assign them to a Cost Layer’s Projection Type. Open the Projection panel for the relevant Cost Layer, select Metric - Auto, and choose your metric from the Associated Business Metric dropdown.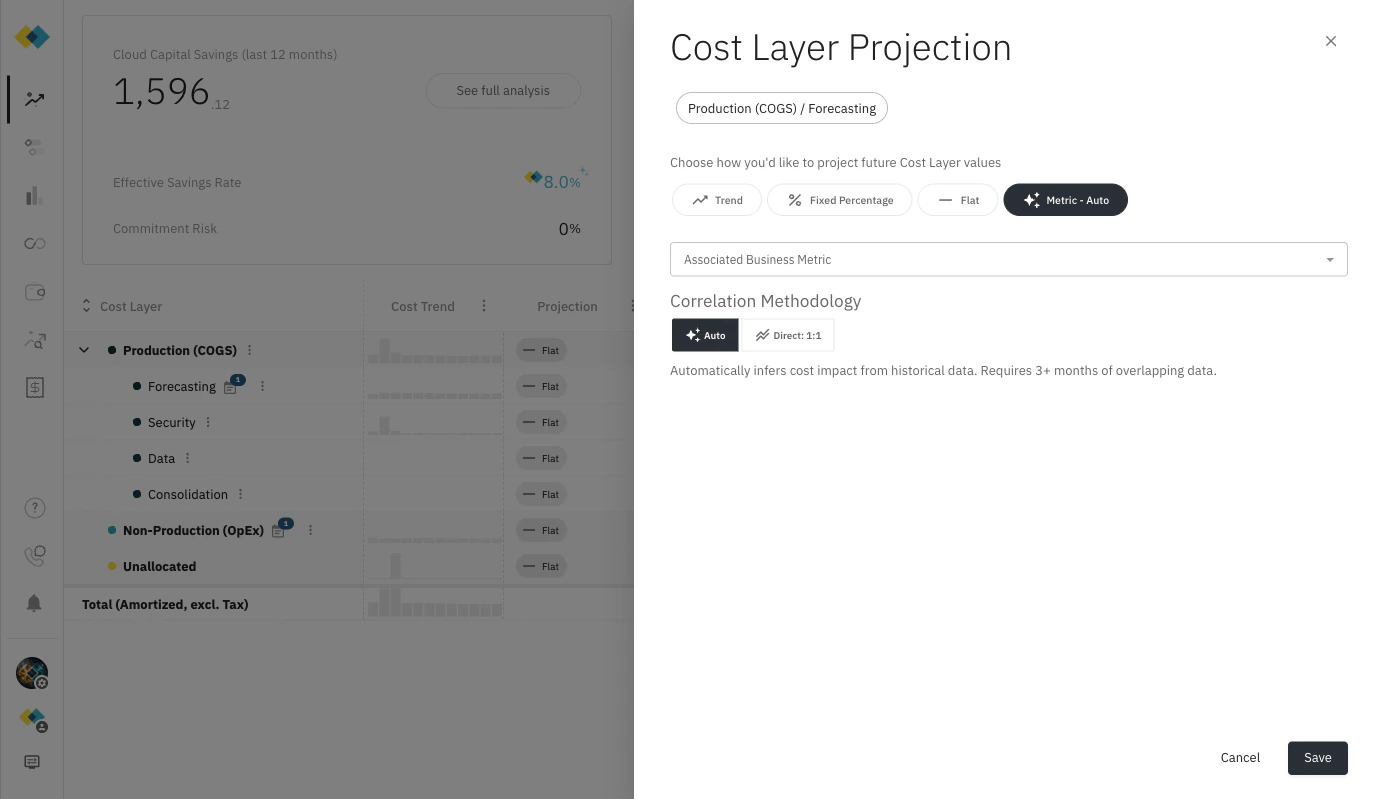
Correlation feedback in the dropdown
When you open the Associated Business Metric dropdown, Cloud Capital shows a correlation assessment next to each metric based on the historical relationship between that metric and this Cost Layer’s actual spend.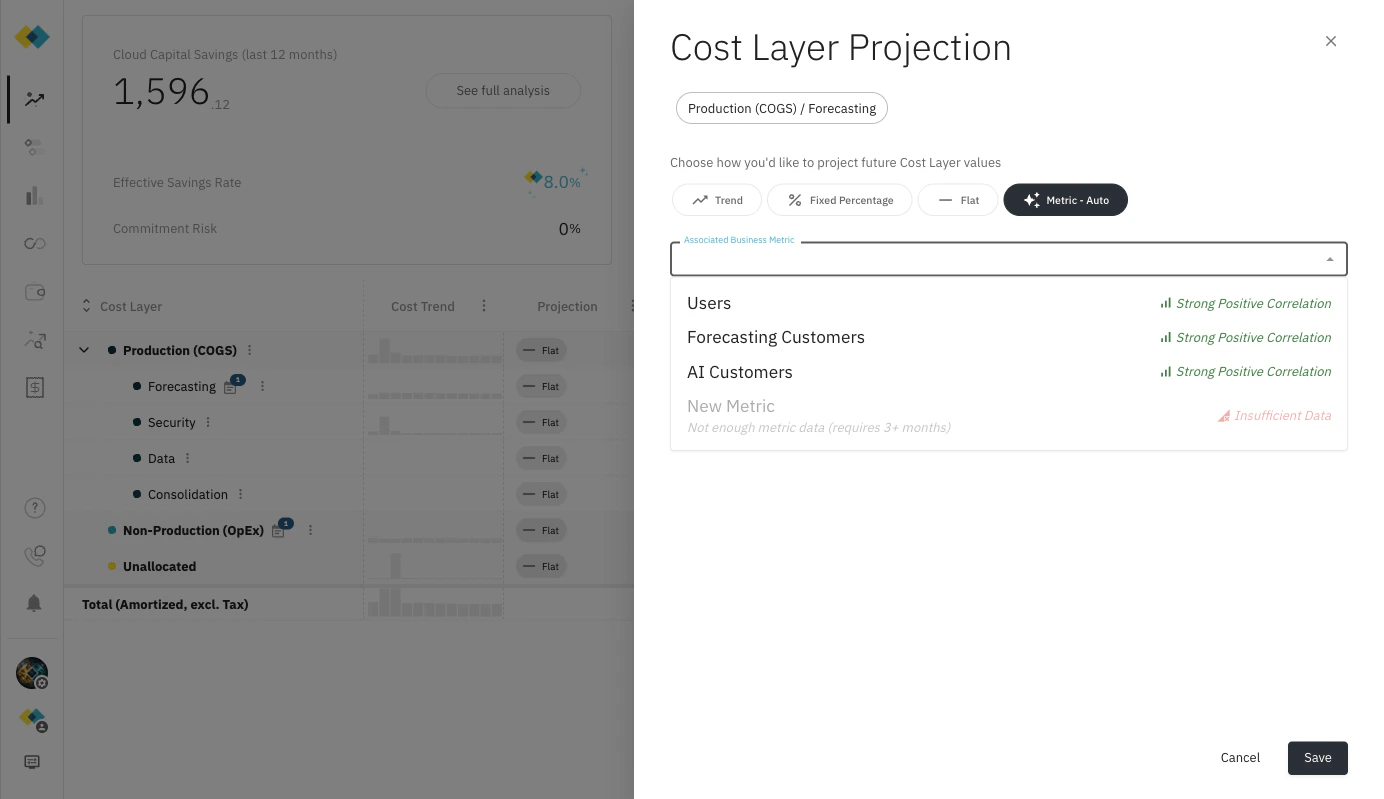
Only metrics with sufficient historical data can use the Auto methodology. Newly created metrics will show as Insufficient Data until at least 3 months of actuals are in place.
After selecting a metric
Once you select a metric, Cloud Capital shows you two things before you commit: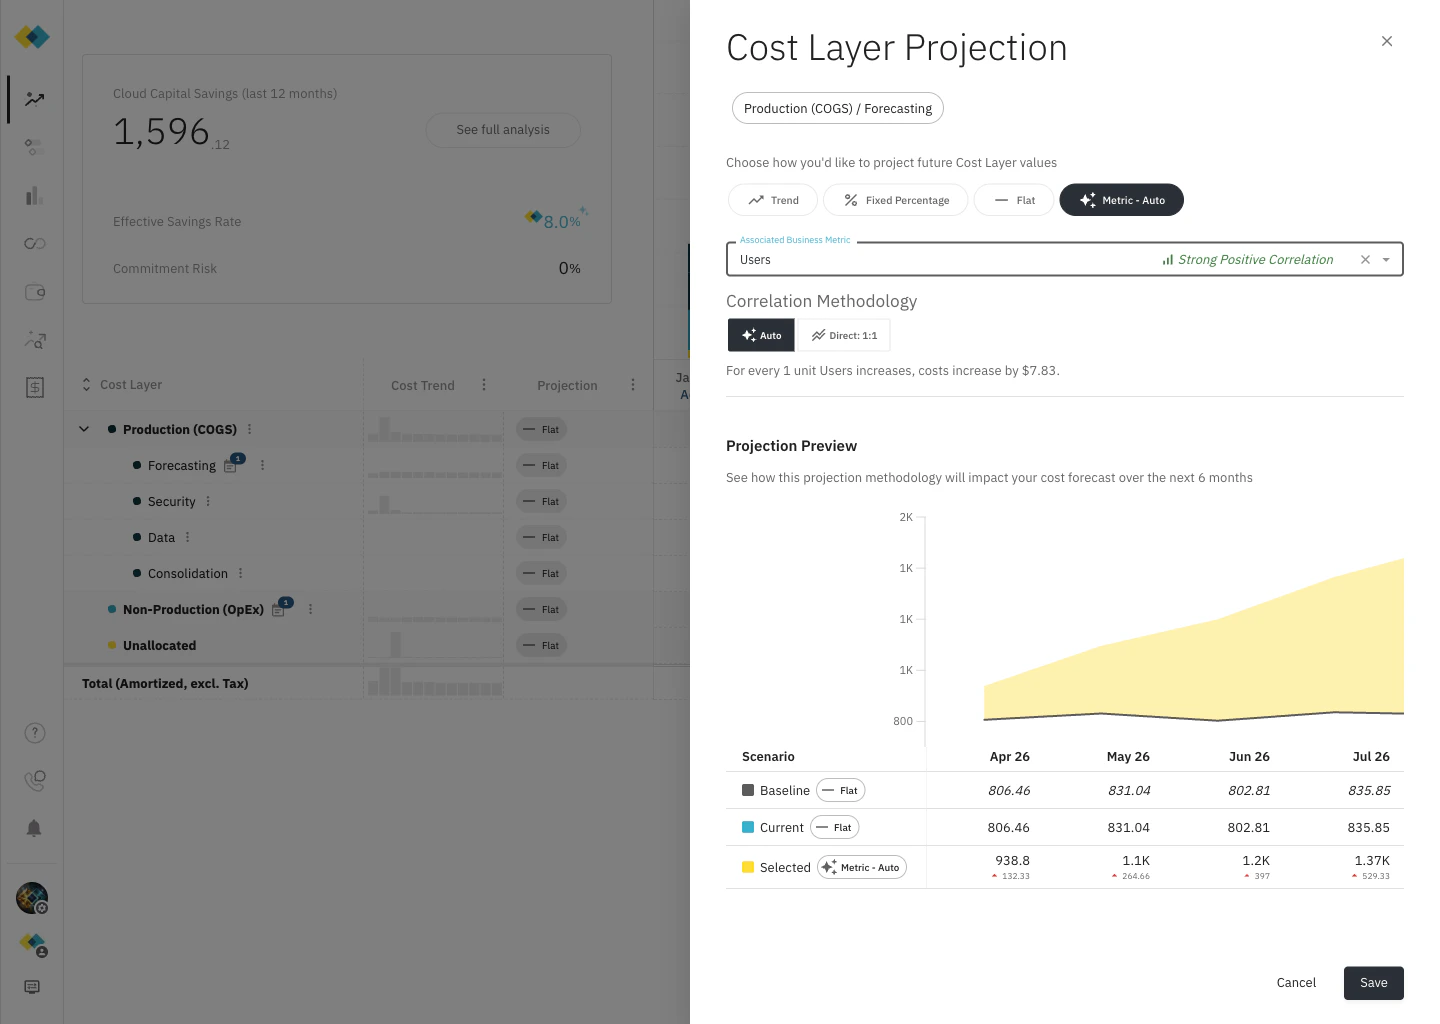
Correlation methodology options
With a metric selected, you can choose how Cloud Capital uses it: Auto — Cloud Capital infers the cost impact from the historical data, deriving the coefficient automatically. This is the default and works best when you have at least 3 months of overlapping data. The correlation description tells you what coefficient was calculated. Direct: 1:1 — Cost is projected to move in exact proportion to the metric. If your metric grows 10%, costs are projected to grow 10%. Use this when you do not yet have enough historical data for Auto, or when you have a strong operational reason to expect a direct proportional relationship.Related pages
Forecasting Overview
How business metrics fit into the full forecast model.
Projection Types
Metric-Auto and all other projection methodologies explained.
Cost Layers
The Cost Layer structure metrics are connected to.
Import from Google Sheets
Sync business metrics directly from a Google Sheet.